There’s an increasing amount of empirical data available on trademark registration systems. The USPTO released a comprehensive dataset three years ago, and there are less complete and less user-friendly data sources available from other national and regional offices–though some offices make it a bit tricky to get their data, and others restrict access or charge for their data products. As with most trends in legal scholarship, the empirical turn has come late to the study of trademarks. Part of this is because the scholarly community is small, and not as quantitatively-minded as other disciplines. Part of it is because it’s not clear what questions regarding trademarks we might look to empirical evidence to answer. I’ve published a study of the impact of the federal antidilution statute on federal registration (spoiler alert: it adds to the cost of registration but doesn’t seem to affect outcomes), but that’s a pretty narrow issue. What else could we learn from this kind of data?
One possibility is to examine the link between trademarks and economic activity. People who make a living from commerce involving intellectual property like to emphasize how important IP protection is to the economy, though the numbers they throw around are a bit dubious. But if we were serious about it, could we rigorously draw some link between trademarks–which are the most common and ubiquitous form of intellectual property in the economy–and economic performance?
I’ve been thinking about how we might do so, so I brought my modest quantitative analytical skills to bear on the best data currently available: the USPTO’s dataset. I thought I’d just look to see whether there is any relationship between trademark activity (in this case, applications for federal trademark registrations) and economic activity (in this case, real GDP). And it seems that there is one…kind of.
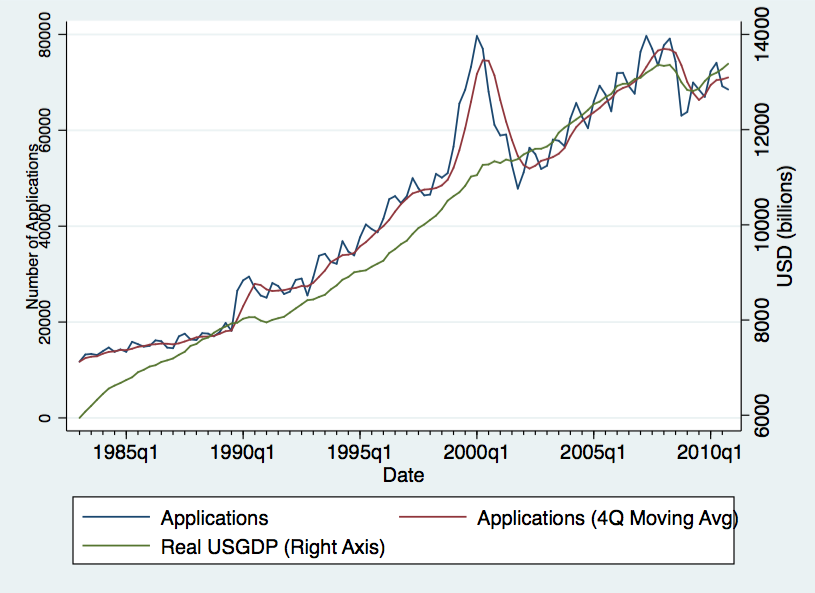
The GDP data from the St. Louis Fed is reported quarterly and seasonally adjusted; I compiled the trademark application data on a quarterly basis and calculated a 4-quarter moving average as a seasonal smoothing kludge. We see that trademark application activity is strongly seasonal, and that it tends to roughly track GDP trends–perhaps with a bit of a lag. The lag is interesting if more rigorous analysis bears it out: it seems to suggest that trademarks, rather than driving economic activity, are merely a lagging indicator of that activity.
The big exception is the late 1990s to the early 2000s. As Barton Beebe documented in his first look at USPTO data, this spike in trademark activity seems to correspond with the dot-com boom and bust. (Registration rates also dropped during this period–lots of these applications were low-quality or quickly abandoned.) It’s interesting to see that this huge discontinuity in trademark application activity doesn’t correlate with anywhere near as big an impact in the overall economy. We could speculate about why that might be–it probably has something to do with the “gold-rush” scramble to occupy a new, untapped field of commerce, and I suspect it also reflects (poorly) on the value of the early web to the overall economy.
This is an example of the kind of analysis these new data sources might be useful for–and it’s not that tricky to carry out. Building this chart was a couple hours’ work, and I’m no expert. A more rigorous econometric model is beyond my expertise, but I’m sure it could be done (I’m less sure what we could learn from it). What other kinds of questions might we look to trademark data to answer?


1 Response
[…] into Japan’s trademark registration system (as a foundation for the kind of work discussed in this post). Many thanks to Kevin Collins (who did this program last year) for flagging this opportunity, and […]